Tuesday 30 April 2013

Nifty Update


Nifty Daily.


The Path Ahead for Nifty.

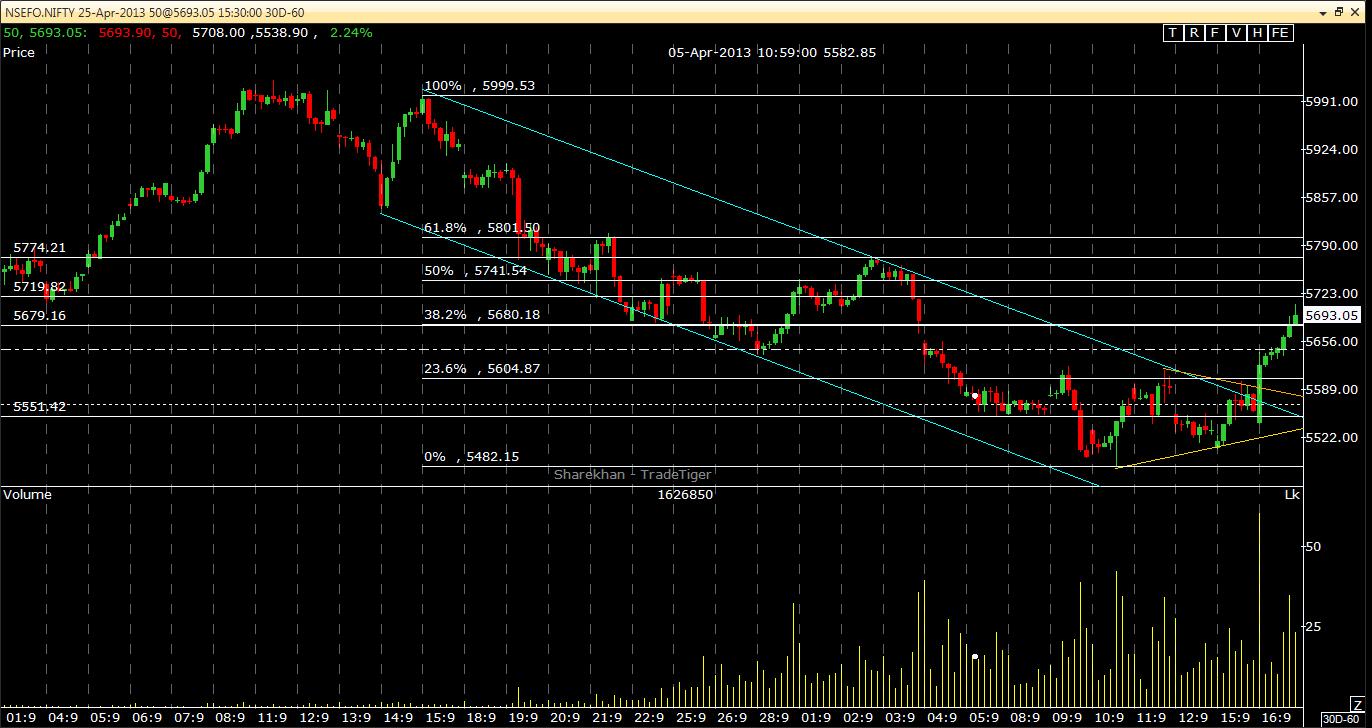
In our previous posts we were quite bullish on Nifty, but the last few trading sessions show that uncertainties have started to built up and Nifty seems to take a breather with quite a few short levels to be broken before finally confirming the downtrend.

Bank Nifty started showing signs of weakness even before Nifty. Adding fuel to fire. It has high probability of finding support near 12,140.

Currently, the levels of past few Gap ups (see the GAP written in the chart.) are the short term targets. The levels being 5880,5861,5843, 5816 and 5783. Once these are broken we can witness the continuation of the downward  channel.

Nifty being on its highs for the past few days has lost strength in the 60 mins charts. All things pointing in one direction that the short term seems to be on the downside. However, the past few Gaps are so near to each other that the continuation of downward channel would come in force only when the last level of Gap is broken on downside.


Get Nifty Vision's update on Facebook, Visit:
https://www.facebook.com/pages/Nifty-Vision/506045946124548?fref=ts

And

Call 0-8585994465 and 0-9958781212 for our Advisory Services. For further details visit:
http://niftyvision.blogspot.in/p/advisory-services.html


Friday 26 April 2013

Technical Analysis Course in Delhi.


New Delhi Institute of Financial Markets
(NDIFM)


Technical Analysis Course (EOD).


Why us:
An educational institute is a place of knowledge. And knowledge must be imparted with utmost honesty. Technical analysis is basically a study of human psychology towards stock markets. Therefore, it must be taught by people who have gained experience by trading.
Generally, the faculties for Technical Analysis are people having bookish knowledge and do not trade. Our faculty is not only an Analyst but a Trader as well, who trades in the real time environment. And teaches you beyond the limitations of a book, by sharing his personal experience of trading. Hence, helping you to sharpen your technical skills.
Visit the faculty profile:
( Also a Faculty for Technical and Derivative Analysis at V-Tips, Prithvi Financial Advisory, Wise Trader, Innobuzz knowledge solutions,etc. in New Delhi.)
Suitable For :
Investors / Traders / Dealers / Sub-brokers / Relation Managers / Asst. Relation Managers / Professionals / Graduates / Under graduates / Retired / Other people willing to earn a living by trading./ Students preparing for CMT(US) I & II / CFT.(India) / M.B.A. (Finance & Financial Markets) / CFA (US and India).

Career Opportunities:

1. Work as a Technical Analyst with Brokerage and Research Firms.
2. Fund Manager - Individual or Institutional.
3. Trader.
4. Massive business opportunities. 


For the Complete Technical Analysis Course details, Visit:
http://niftyvision.blogspot.in/p/technical-analysis-course-in-delhi_20.html

The complete Capital Market Analysis course include:

  1. Capital Market Basic Module.
  2. Technical Analysis Module.
  3. Option / Derivative Analysis Module.


Free Demo Classes held every weekend.

Book your time slot.

Classes held on Weekdays (Evening) and Weekends (Full day).

CALL :  0-8585994465, 0-9958781212.

Follow Nifty Vision on Facebook, Visit:
https://www.facebook.com/pages/Nifty-Vision/506045946124548?fref=ts

Tuesday 23 April 2013

Nifty Update


Anticipated on 02nd April 2013

The upward momentum still seems to have strength on the 60 mins charts, which takes Nifty to a leg up approx. towards 5850 as a target within the current expiry.
( An abstract from Nifty Update post dated 02/04/2013)


Happened on 22nd April 2013

( Nifty Daily)


Nifty moved as anticipated.


The above shown charts clearly depict that Nifty moved as anticipated and moved approx. 5850. Anyone who is continuously reading our posts and trading; would have made a huge profit within this current expiry itself. We projected nifty to find support near 5500 levels and going up towards 5850 as our target. ( To get the exact details please read our previous posts.)

Currently we are at the top of the on going downward channel and the previous Gap up opening (5816 - 5873) are likely to act as an important support. From here on, till 5873 is intact much of bearishness will not  be seen. It is only after this Gap is broken on the down side we may witness the continuation of the channel.

Till then the levels of Gap i.e., 5816 - 5773 will be the key zones and market will continue to remain bullish till these levels are intact.


Get Nifty Vision's update on Facebook, Visit:
https://www.facebook.com/pages/Nifty-Vision/506045946124548?fref=ts

And

Call 0-8585994465 and 0-9958781212 for our Advisory Services. For further details visit:
http://niftyvision.blogspot.in/p/advisory-services.html


Wednesday 17 April 2013

Nifty Update


Nifty 60 mins


Nifty Daily


Nifty Weekly


Nifty moved as expected.
What's next....?


In our previous post on Nifty Update we mentioned that a breakout above 5588 would take Nifty to 5680 and 5719 as the next levels. And, Nifty moved as anticipated, that too by forming a wedge (see the yellow lines on 60 mins charts).

Now that we have achieved our target, what's next? 

Today's big up move would have changed the sentiments of many people. But wait! There is something else to look at. And that is the changes in the charts now.

Observing the 60 mins chart, one can notice the close of last two trading hours is much below its high and the various retracement levels. The candle stick formations in the last two hours are not a good sign for continuation of the up move. Lot depends on tomorrows open. For this upside to continue Nifty must not break 5663 with an important support of 5680 in between. 

Daily chart looks positive with filling the Gap Down area, but closing near the upper end of the Gap and below the projection line we have been following. And, on weekly charts, Nifty is at a major Gann Resistance. 

Overall, a cautious approach needs to be followed as 5663 and 5720 remain two important zones as per the current scenario. A break on either side would decide the trend.  And the next levels are clearly visible in the 60 mins chart. Not to forget the importance of tomorrow's opening.

Get Nifty Vision's update on Facebook, Visit:
https://www.facebook.com/pages/Nifty-Vision/506045946124548?fref=ts

Sunday 14 April 2013

Free Stock Tips


Our Advisory clients made a whooping 130% profit in Infosys on 12/04/2013, even when it fell so much.
You could also have been a part of our happy family of clients.


Give yourself the Bread and Butter of life..........Get to know the market trend before it actually happens.........Subscribe to Nifty Vision.

You have already witnessed the accuracy of our analysis. Benefit yourself and earn by subscribing to our Advisory Services.

For further details, Visit:
http://niftyvision.blogspot.in/p/advisory-services.html

Friday 12 April 2013

Infosys Update


Infy Daily


Infy weekly


Infosys.......!
Results Impact or Pure TA?


Quite often we hear that many TA's say that a chart alerts us of what is about to happen. And, the rest of the events is just a formality. But is this saying apt for Infy? Let's judge this.

Prior to the declaration of Infosys results today morning, Infy chart warned about the possible blood bath. And that too a few days before. The Indicators, Pattern & Candle Sticks formation on the daily chart and Fibonacci & Gann theory on weekly chart said it all.

On the daily charts,  the Resistance line and the Bollinger bands clearly showed the formation of a Double Top, which was further confirmed by the a bearish inverted hammer; the same candle being a bearish harami as well. All three negatives. Even prior to the these formations MACD and RSI were giving negative divergence (see the yellow dotted lines on daily charts.). And today's Gap Down opening (2916-2551 levels) was enough for even further confirmation.

Coming to the weekly charts; a perfect display of Retracements and Gann. Now that's very interesting. 
Infy weekly chart has been moving into the Retracement levels of the prior advance from Feb'2009 - Jan'2011. On the current levels, price was on the resistance levels of the Gann Box (see the various purple boxes in weekly charts.) which coincidentally also happened to be around the 23.6% retracement level. As evident from the weekly charts, Infy has been respecting the levels of Gann Box which from a long time have acted as reversal zones.

And all this was much before the announcements of Q4 results today, setting us to make bearish positions and personifying the statement mentioned in the beginning of this post; with a PICTURE PERFECT example.

For now, the bias for Infy remains negative with its resistance levels at 2551, 2916 and 3000. Till these levels are broken the intermediate / long term trends will remain negative.

Get Nifty Vision's update on Facebook, Visit:
https://www.facebook.com/pages/Nifty-Vision/506045946124548?fref=ts
OR
Call 0-8585994465 and 0-9958781212 for our Advisory Services. For further details visit:
http://niftyvision.blogspot.in/p/advisory-services.html


Latest Infosys Results


RESULTS IMPACT


Infosys tanks 20 per cent on lower FY14 revenue guidance.

Q4 net up 3% YoY.

Infosys ' fourth quarter net profit rose slightly higher-than-expected 3 percent year-on-year (1 percent quarter-on-quarter) to Rs 2,394 crore, helped by higher other income and lower income tax expenses.

However, its revenue growth of Rs 10,454 crore, up 18 percent YoY (0.3 percent sequentially), was lower than what the street had forecast, sending its shares tumbling over 15 percent in opening trades.

Analysts on average had expected India's second largest software services exporter to report a net profit of Rs 2,297 crore, on revenue of Rs 10,730 crore, according to a CNBC-TV18 poll.

Infosys has guided for a full year revenue growth of 6-10 percent in FY14, which is also much lower than the 12-14 percent growth industry body NASSCOM has forecast. It has not provided earnings per share guidance for the full year.

Source: Economic times and Money control.

Results impact:
Infy opened 12.51% down than yesterday's close, creating a huge gap as it usually does on the event of its results.
We will post a report on Infy's result impact on charts later in the evening today.


Get Nifty Vision's update on Facebook, Visit:
https://www.facebook.com/pages/Nifty-Vision/506045946124548?fref=ts

Free NSE Tips


Give yourself the Bread and Butter of life..........Get to know the market trend before it actually happens.........Subscribe to Nifty Vision.

You have already witnessed the accuracy of our analysis. Benefit yourself and earn by subscribing to our Advisory Services.

For further details, Visit:
http://niftyvision.blogspot.in/p/advisory-services.html

Tuesday 9 April 2013

Nifty Update


Nifty 10 mins


Nifty 60 mins


Nifty Daily


Imperative Moment in Nifty.

Before having a view of the above charts please read our first post on Nifty Update date 20/3/2013, where we clearly mentioned that a break below 5675 can move the levels further down till 5550. And that's what exactly happened.

Now, that we are at 5550 levels, the scenario of the charts show the following:
  1. Lets first analyse the intra day 10 mins and 60 mins charts. Both the charts shows a divergence at these levels. In the shorter version prices consolidated for the entire day on 08/04/2013 and were unable to break the upper levels of previous Gap Down i.e. 5588.
  2. Again we witness the same divergence on the daily charts. But even important is the price level which is at lower level of the channel. 
  3. And the same price level holds true on weekly charts as well.
With divergence in all three time frames, and the ongoing price level, much of an upside is on the cards. Not only because of the above mentioned reasons, but to add the most significant reason for the upward expectation is that 5550 is one of the levels where the ongoing wave 4 might reverse. 

But for this to happen, price has to pass through two hurdles:
  • It has to break the upper level of previous Gap Down, and
  • Most importantly, it has break the ongoing downward channel as well.
If we closely observe the candlesticks formation on the current 60 mins chart, the support is at 5550. And upside will happen only if price is able to successfully breach 5588. However, if 5550 is broken we can see Nifty finding its next support at 5500 i.e. the level of ongoing channel in 60 mins chart. And if 5588 is broken on upside the next levels will be levels of the horizontal lines in the intra day charts.

Hence, one has to wait to the breakout on either side to get the exact trend. Till then Nifty will be sideways.

Get Nifty Vision's update on Facebook, Visit:
https://www.facebook.com/pages/Nifty-Vision/506045946124548?fref=ts

Monday 8 April 2013

Technical Analysis Course in Delhi


New Delhi Institute of Financial Markets
(NDIFM)


Technical Analysis Course (EOD).


Why us:
An educational institute is a place of knowledge. And knowledge must be imparted with utmost honesty. Technical analysis is basically a study of human psychology towards stock markets. Therefore, it must be taught by people who have gained experience by trading.
Generally, the faculties for Technical Analysis are people having bookish knowledge and do not trade. Our faculty is not only an Analyst but a Trader as well, who trades in the real time environment. And teaches you beyond the limitations of a book, by sharing his personal experience of trading. Hence, helping you to sharpen your technical skills.
Visit the faculty profile:
( Also a Faculty for Technical and Derivative Analysis at V-Tips, Prithvi Financial Advisory, Wise Trader, Innobuzz knowledge solutions,etc. in New Delhi.)
Suitable For :
Investors / Traders / Dealers / Sub-brokers / Relation Managers / Asst. Relation Managers / Professionals / Graduates / Under graduates / Retired / Other people willing to earn a living by trading./ Students preparing for CMT(US) I & II / CFT.(India) / M.B.A. (Finance & Financial Markets) / CFA (US and India).

Career Opportunities:

1. Work as a Technical Analyst with Brokerage and Research Firms.
2. Fund Manager - Individual or Institutional.
3. Trader.
4. Massive business opportunities. 


For the Complete Technical Analysis Course details, Visit:
http://niftyvision.blogspot.in/p/technical-analysis-course-in-delhi_20.html

The complete Capital Market Analysis course include:

  1. Capital Market Basic Module.
  2. Technical Analysis Module.
  3. Option / Derivative Analysis Module.


Free Demo Classes held every weekend.

Book your time slot.

Classes held on Weekdays (Evening) and Weekends (Full day).

CALL :  0-8585994465, 0-9958781212.

Follow Nifty Vision on Facebook, Visit:
https://www.facebook.com/pages/Nifty-Vision/506045946124548?fref=ts

NSE Stocks in ban period


NSE Stock in Ban Period for 08th April 2013.

HDIL

Friday 5 April 2013

Nse Stocks in Ban period


Nse Stocks in Ban period for 05th April 2013

HDIL

Nifty Update

Nifty 10 mins


Nifty 60 mins


Nifty Daily


Bulls thrashed.


The ongoing upside came to a halt, when Nifty first tested its resistance at 5774 as mentioned in the previous Nifty Update post and then a hint of pre-mature elections by BJP leader Mr. L.K. Advani. With the current political instability in the nation, Bulls were unable to carry on with the upward momentum and were thrashed.

But, did the charts gave hints of an upcoming crash even before it happened? The answer in bold letters is YES.

Look at the 10 and 60 mins chart. Both have two things in common:
  1. The test of resistance level at 5774.
  2. Two consecutive GAP DOWN openings.
This resistance level was clearly mentioned in our previous post on Nifty Update. This resistance level was highly respected. And if the on going upside had to continue, it had to break this resistance. Which it did not. Rather, we witnessed a Gap Down opening. A close view of the 10 mins charts clearly showed that the uptrend was broken along with the Gap Down opening and markets hovered around to test the trend line. Also, look at the negative divergence in RSI on the 10 mins chart.

Now observe the 60 mins chart. RSI came below it's smoothened average line and the Bollinger Bands expanded on the downside to confirm the beginning of a fall.

And all this happened even before BJP chairman Mr. L.K. Advani spoke about the possibility of early elections.

Currently, Nifty looks in a bearish mood, which we also mentioned about in our previous post that uptrend will continue till the prior Gap Up is not broken  and on the post dated 20/03/2013, that the long term bias is negative. But for the short term, the trend remains on the negative side till today's gap created due to Gap Down opening is not broken on the upside. The levels of Gap being 5688-5658.


Thursday 4 April 2013

NSE Tips


Give yourself the Bread and Butter of life..........Get to know the market trend before it actually happens.........Subscribe to Nifty Vision.

You have already witnessed the accuracy of our analysis. Benefit yourself and earn by subscribing to our Advisory Services.

For further details, Visit:
http://niftyvision.blogspot.in/p/advisory-services.html


Tuesday 2 April 2013

Nifty Update


Nifty Moved as Expected

In our previous Nifty post on 27th March 2013, we mentioned the two targets of our benchmark index at 5680 and 5720 respectively. Nifty was bang on targets giving it's close at about 5680 on 27/03/2013 and 5726 on 01/04/2013, that too with a gap up opening on the latter day.

Now, that the two targets and divergence has been achieved on daily charts, the shape of weekly charts has turned positive with a bounce from the current low of the on going downward channel. The upward momentum still seems to have strength on the 60 mins charts, which takes Nifty to a leg up approx. towards 5850 as a target within the current expiry. However, with an important resistance at 5774 on intra day charts.

Important thing to notice is that the close of previous week and open of the current week is approximately near the projection line we mentioned in our Nifty post on 20th March 2013. Making our analysis even better and stand apart.

To conclude the current upside move is still likely to continue with it's projection at about 5850 (see the aqua line in the chart) and the bias presently remains positive till the gap is filled on daily charts.